
Data Solutions
LEGUAAN™ Software
Water Quality Monitoring
Data Visualisation and Reporting
CBSS launched LEGUAAN™ SaaS – our Water Quality Monitoring Data Visualisation, Management and Reporting software solution, to provide a service that will convert water monitoring data into interactive graphs and reports, quickly, and with no effort from your side.

We are providing the LEGUAAN™ SaaS, because we know what it means to be struggling for hours on a spreadsheet to generate just a simple time-series graph of water quality and/or quantity data for a number of monitoring locations. We know what it entails to have to sit and copy and paste all the results from individual laboratory reports for each of your monitoring locations into one big Excel-spreadsheet, which you know carries the risk of introducing typing-errors. And yes, once you are finished carrying the results over into your spreadsheet, you do not even have a single graph or chart to show for all your efforts – and you KNOW creating those charts will take you even longer!!
That’s why our LEGUAAN™ SaaS solution was born: To take the effort out of making your water monitoring data presentable in a visual format.
Learn More About
LEGUAAN™
Software-as-a-Service
It determines the equity and efficiency in water resource and services allocation and distribution, and balances water use between socio-economic activities and ecosystems that supports the human use of natural resources”. Water governance includes the formulation, establishment and implementation of water-related policies, legislation and institutions, and clarification of the roles and responsibilities of government, civil society and the private sector in relation water resources and services. The outcomes depend on how the stakeholders act in relation to the rules and roles that have been taken or assigned to them, AND on how those rules are applied and implemented by those responsible for enforcing them.
Visualize Your Data
LEGUAAN™
Output Examples
Any type of water quality or quantity table, graph, or report (such as the examples below) can be generated with the Leguaan™ SaaS, to suit your specific needs:
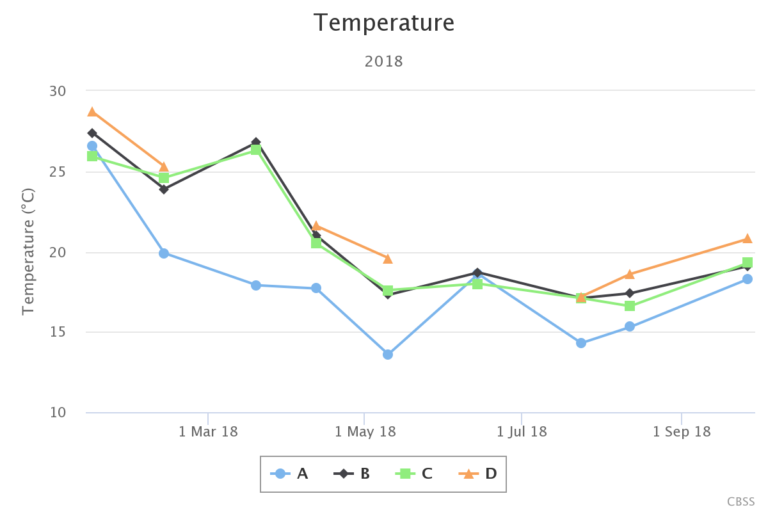
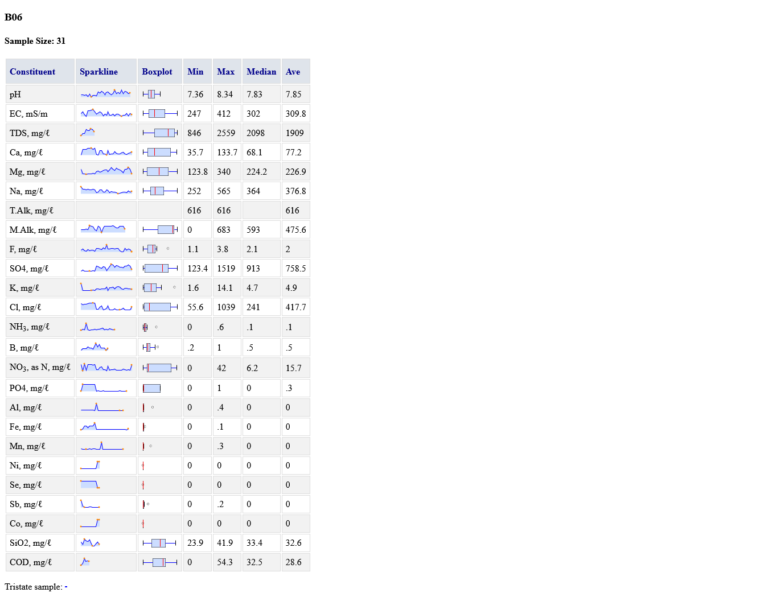
Using traditional methods such as Excel spreadsheets and expensive charting software, it would take you hours to crunch the numbers to achieve similar outputs, which will certainly be less informative and responsive. Your graphs will be updated instantaneously when your latest lab reports are added. These reports and graphs can be set up to compare your data to the limit values in your water use licence, or any other site-specific limit value specified by a government agency.
We can also assist you with the development of site-specific limit values in accordance with the new DWS policy on Water Quality Management. Your historic data for existing locations can be uploaded to LEGUAAN™. Our Software will save you time and money when dealing with your water quality and quantity data, and will help you to turn unmanageable spreadsheets or hundreds of lab reports, into easily understandable and visualised management information.
Choose Your Pricing Plan
Our LEGUAAN ™Packages
We have designed our LEGUAAN™ SaaS to make it easy for you to manage your water quality data. We offer it as different types of subscription packages, giving you the flexibility to choose one that will meet your specific needs. These are just guideline prices, contact us for a bespoke quotation:
/ sample
- Data verification and Validation
- Salt-balance (Mauchino) diagrams for each sample taken
- Dashboard summaries for all variables analysed
/ sample
- Data verification and Validation
- Salt-balance (Mauchino) diagrams for each sample taken
- Dashboard summaries for all variables analysed
- Time-series graphs for each variable analysed, categorised into groups of similar samples
/ sample
- Data verification and Validation
- Salt-balance (Mauchino) diagrams for each sample taken
- Dashboard summaries for all variables analysed
- Time-series graphs for each variable analysed, categorised into groups of similar samples
- Box-and-whisker plots for samples from similar types of water
- Frequency and Variable compliance reports
Additional Services
We know that the water quality compliance requirements specified by government agencies in your WUL are more often than not, either not scientifically correct, or not applicable to your site specific situation, or both.
We have the specialist knowledge to develop site-specific compliance criteria for you, and can assist you with WUL-amendments.
And No, unless you are a water services provider who operates a water purification works, we will NEVER use the SANS241 Drinking Water Standard to compare environmental water quality data against, as it has no scientific merit whatsoever. It is a Drinking Water Standard, and should only be used if you are actually going to drink that water!
Please note
- Costing to use the LEGUAAN™ SaaS is based on the number of monitoring locations, and the number of samples taken at each location. The more monitoring locations you have, and the more regularly you take samples, the more you save, due to the lower price per sample per package.
- Consultants who are in need of a once-off data visualisation of a dataset do not need to subscribe to the monthly service, but can contact us for a quotation
- NOTE THAT LEGUAAN™ IS CURRENTLY IN THE DEVELOPMENT PHASE, AND ONCE WE GO LIVE, WE WILL IMPLEMENT IT ON A FIRST-COME-FIRST SERVE BASIS. MAKE SURE YOU SUBMIT YOUR QUOTE REQUEST WITHOUT DELAY.